
Part I: Data
“ With a traditional survey, statisticians
- identify a target/survey population,
- build a survey frame to reach this population,
- draw a sample, collect the data.
They will build a box and fill it with data in a very structured way. With Big data, data comes first and the reflex of official statisticians would be to build a box ! ”
source: EU Big Data force report on Big Data

source: EKT
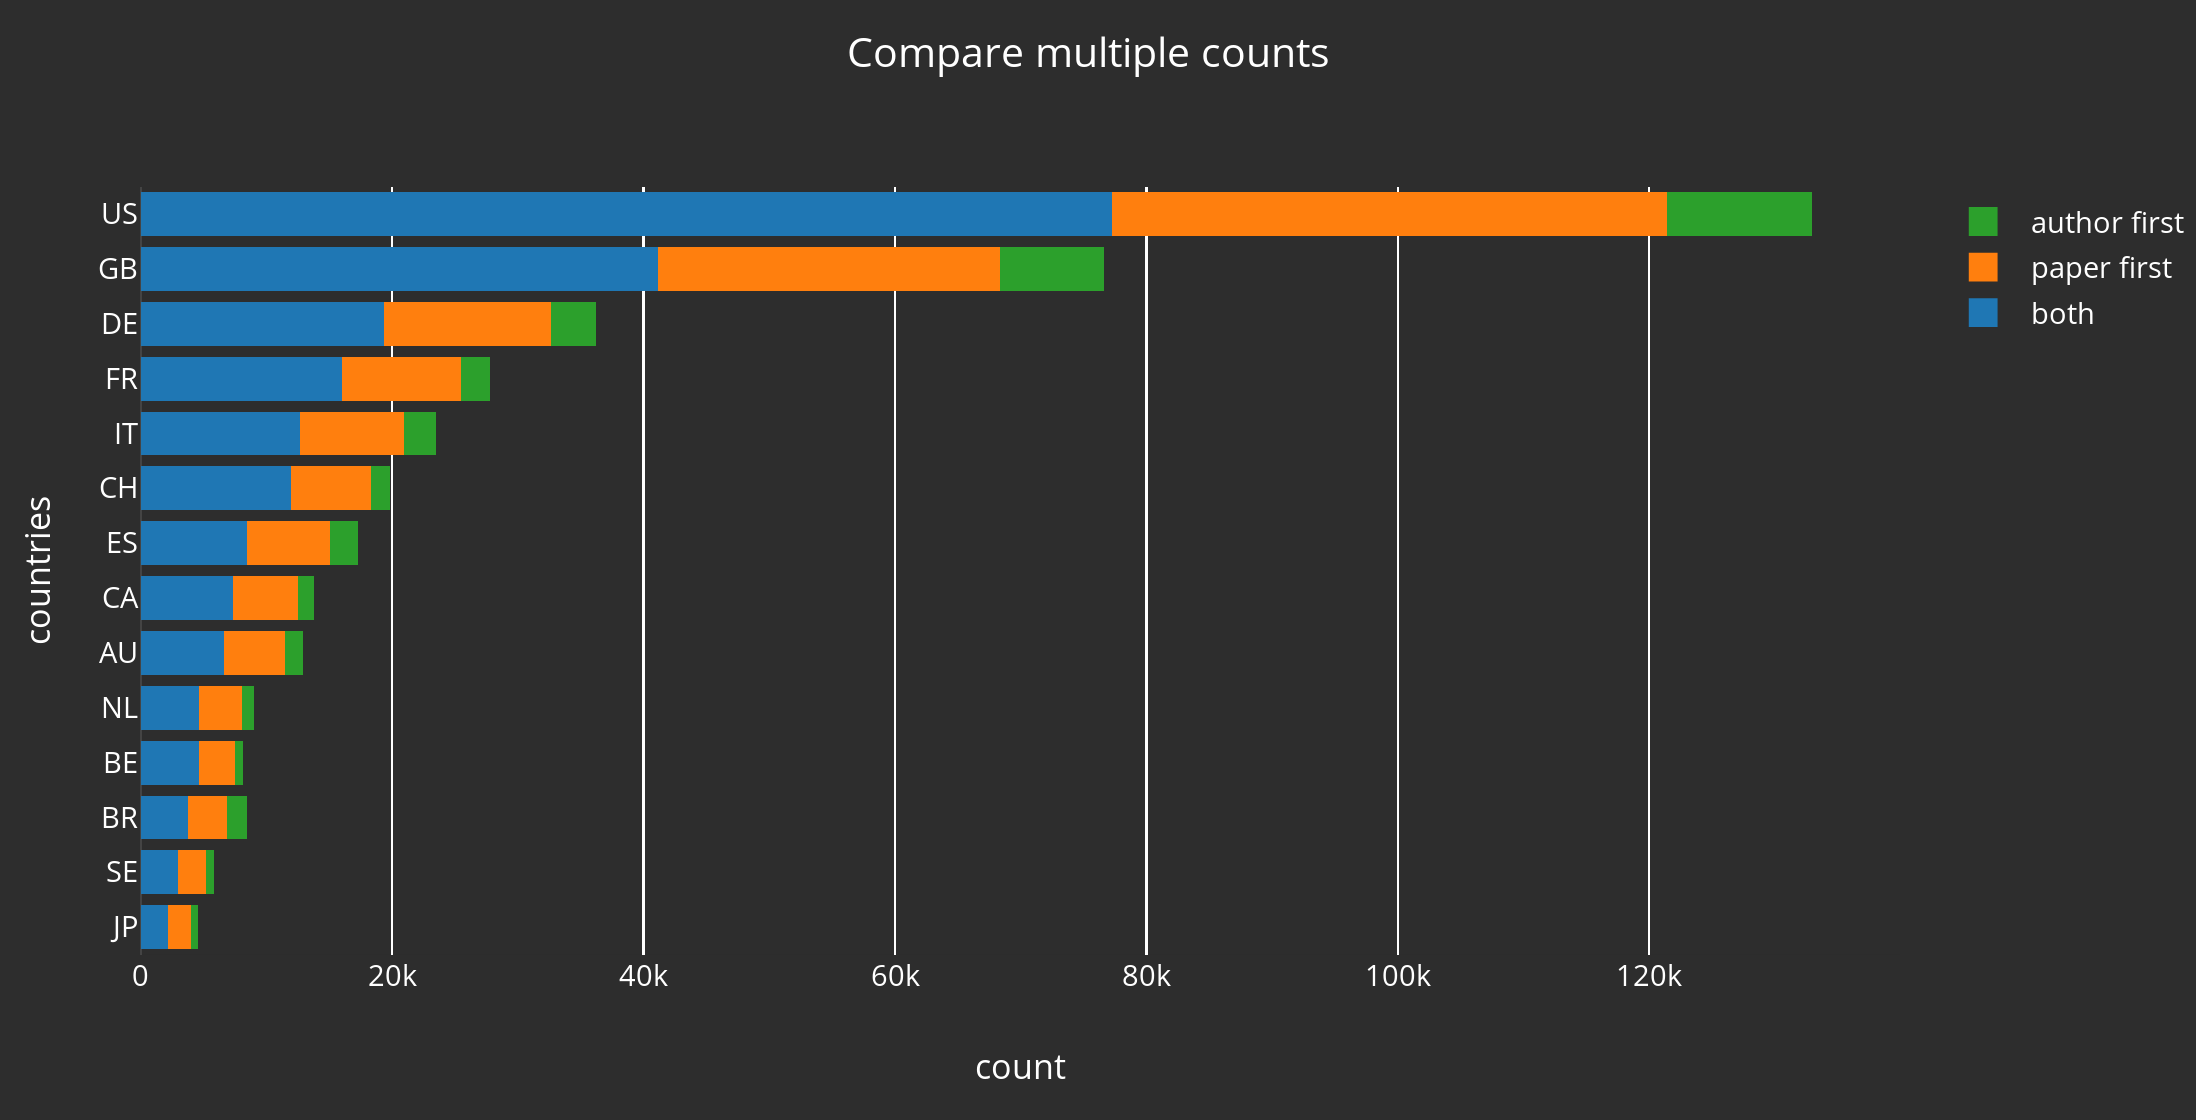
“Academic Presence” Definition
| Data | Definition |
|---|---|
|
|
Alternative Definitions
paper first approach instead of author first


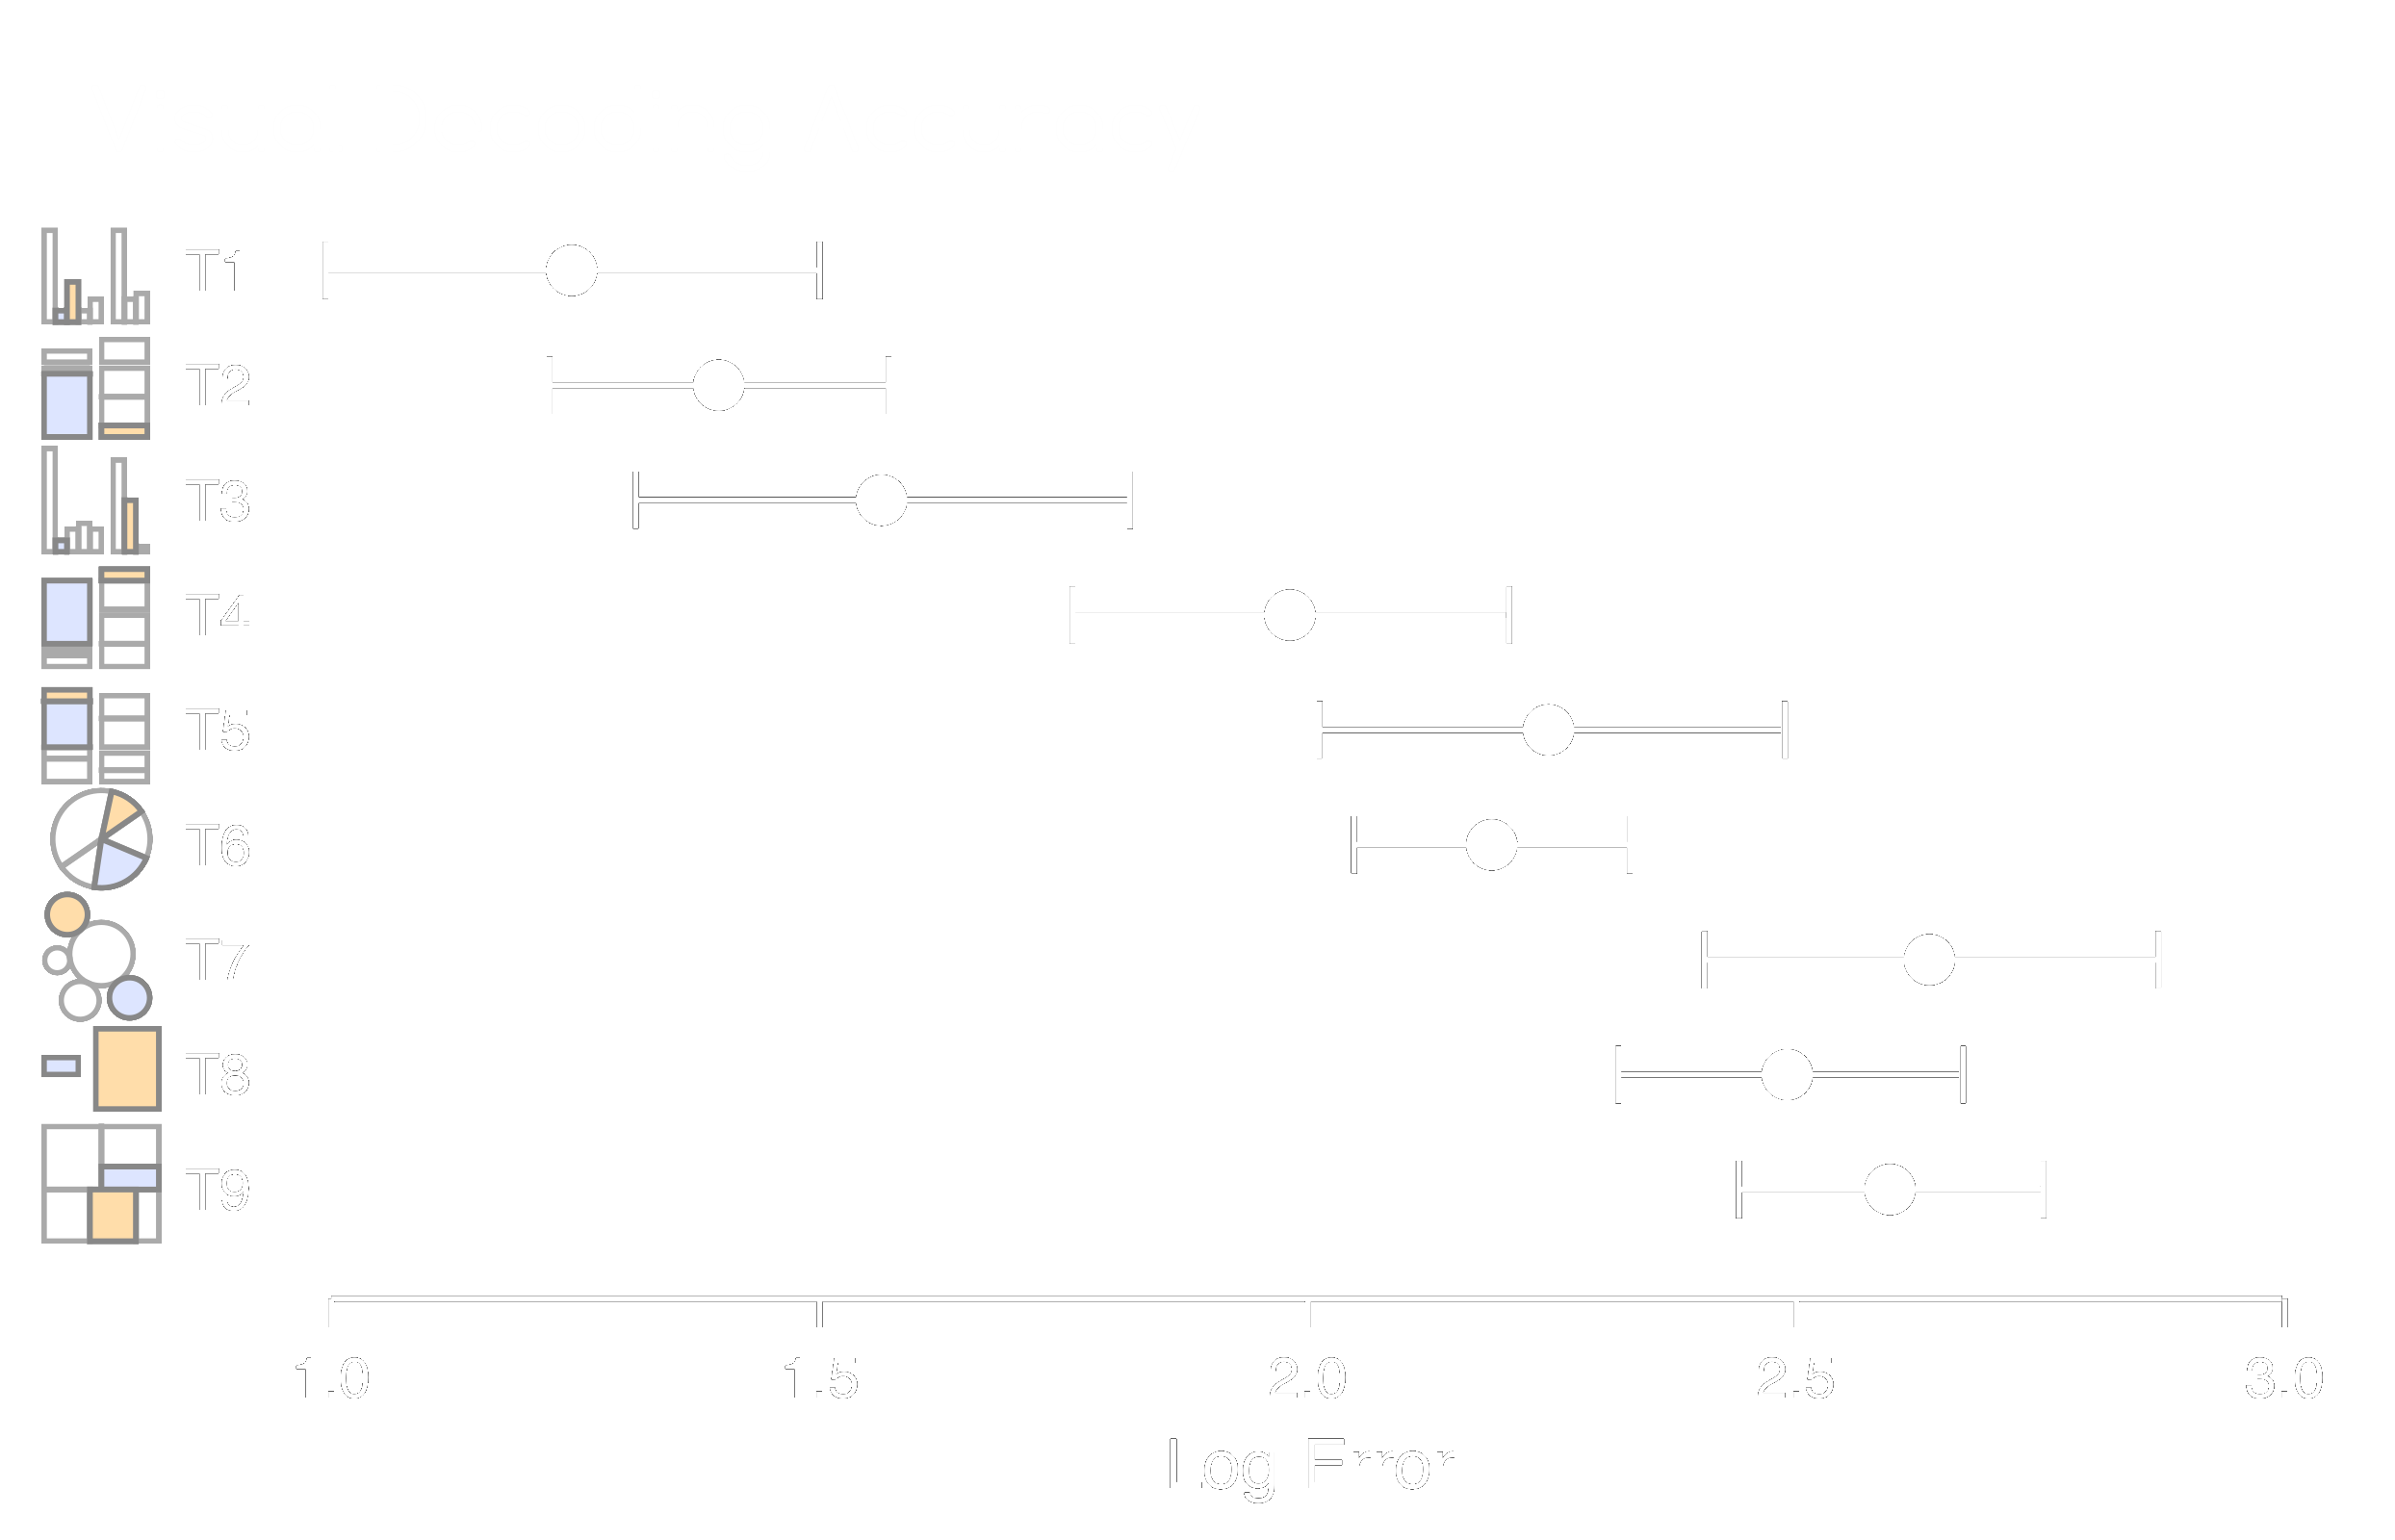
source: Jeffrey Heer and Michael Bostock, Crowdsourcing Graphical Perception: Using Mechanical Turk to Assess Visualization Design

Part III: Big Data Vis
| Why: | Big data exploratory analysis. We can explore data on coordinates level, instead of country level. |
| Drawbacks: |
|
